User Testing the BHIM App:
Bringing Prototypes to Real Users


Timeline
3 weeks (July 2024)
Scope
Testing Facilitation & Data Analysis
Industry
Fintech
01 | THE CHALLENGE
Millions use UPI transactions, but are they truly seamless? We set out to test our design, uncover usability challenges, and refine the experience based on real-world insights.
02 | RESEARCH OBJECTIVE
Evaluate the usability of key payment flows
Sending money, scanning QR codes, and checking transaction history were tested — to identify friction points and areas for improvement.
Gauge user perception of the new interface
Including visual clarity, navigation, and language accessibility across different user segments and cities.
03 | MY ROLE
Responsibilities & Contributions
Participant Recruitment
50%
Test Session Facilitation
80%
Note-taking & Observation
80%
Synthesis & Reporting
100%
04 | PARTICIPANT STRATEGY

We conducted user testing in Bangalore (Tier 1), Mangalore, and Nashik (Tier 2) to gather richer insights from a diverse user base across urban and semi-urban India — not just metro-centric participants.
1
Cities Tested
Nashik

Bangalore
Mangalore
2
Screening Criteria
We selected participants based on their UPI experience, awareness of BHIM, primary UPI app, device type, and city tier to ensure a relevant and diverse testing pool.


Conducted in-person user testing in 3 cities
3
Participant Recruitement
We recruited participants through on-ground outreach and a Google Form, offering incentives to encourage participation. Responses were tracked using a screening sheet to ensure a diverse and relevant mix of users.

05 | TESTING METHODOLOGY
PARTICIPANT OVERVIEW
14
Young
(18-25 Years)
19
Mid-Age
(25-50 Years)
10
Older
(50+ Years)
Here’s a quick glimpse into the fieldwork that shaped our insights — on-ground interviews across three cities.
Multilingual Testing Approach
To ensure participants were comfortable and expressed themselves freely, I conducted interviews in English, Hindi, and Tamil based on the user's preference.
This allowed us to get richer, more authentic responses, especially from first-time UPI users who were not fluent in English.
Capturing Real Reactions: User Interviews in Action

1


Key UX Principles in Practice

Avoiding Bias
Asking neutral, open-ended questions to avoid leading the user.
Empathy
Making users feel heard and valued.
Observation
Paying attention to how users interact with the app naturally.
Feedback
Assuring users there were no “right” or “wrong” answers.
Data Collection
We used audio and video recording devices to capture user reactions, pain points, and behaviors. These recordings helped us analyze subtle details—pauses, hesitation, and body language—beyond just verbal feedback.

2
Testing three key tasks
We focused on three essential UPI interactions to evaluate usability and pain points. Participants were given realistic scenarios to complete, ensuring their interactions were as natural as possible.

Pay to a contact

Scan a QR code

Pay an electricity bill

Covering diverse user contexts
Social
(Pay to Contact)
Offline
(Scan a QR code)
Recurring
(Pay a bill)
06 | KEY INSIGHTS
Insights and Findings
(A Glimpse)
“A bhel puri vendor in Bangalore struggled to find the ‘Scan QR’ button, assuming it should be on the home screen.”
“Users were hesitant to tap the ‘Pay’ button without a confirmation step, fearing accidental payments.”
56% of users preferred the Light Version over the Dark Version. Over 79% of these users are 25 and above
07 | FINAL REPORT
From Raw Data to Actionable Insights: Synthesizing Our Findings
After conducting user interviews across three cities, we were left with hours of recordings, detailed notes, and observational data. But raw input alone isn’t enough — the real challenge was distilling it into clear, actionable insights.
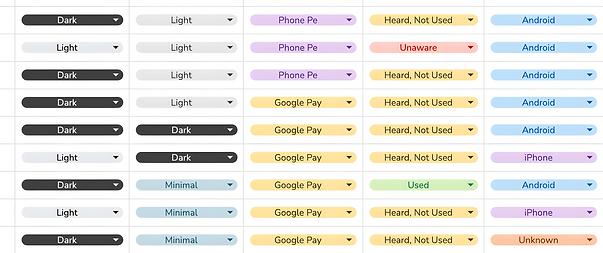
We transcribed the audio recordings and organized responses by user demographics, behaviors, and pain points to identify meaningful patterns and guide design decisions.
Organizing and Structuring the Data
Identifying Key UX Themes
Crafting the final
report
Glimpse of the report


We distilled our findings into a detailed yet concise research report that included user behavior snapshots with direct quotes, key pain points, and actionable design recommendations.
To support these insights with data, we also analyzed task completion times, error and success rates, and broke down performance across cities to highlight regional differences in user experience.
08 | REFLECTION
Personal Takeaways
As a user testing facilitator, I enjoyed engaging with a diverse set of participants and speaking in two regional languages helped put them at ease. Creating a safe, judgment-free space for honest feedback was a priority.
I focused on staying unbiased and open to all perspectives, even when they challenged assumptions. ost-testing, I reviewed recordings and notes to synthesize actionable, data-driven insights for design improvements.
What I'd do Differently
-
Allocate more time for analysis to dive deeper into patterns and user behavior.
-
Test in Real-World Contexts - observing users making payments at a busy vegetable stall—to capture authentic behaviors and challenges faced in everyday scenarios.